For every angry user that leaves a review and rating on your app, ten more just close it forever.
The next time they notice your app they go “Huh, when did I download that?”

If you’re a founder who’s serious about iterating to meet user needs, these are our recommendations for mobile app analytics tools:
- Google Analytics: Analytics platform for ad campaigns and user acquisition tracking
- Amplitude or Mixpanel: Analytics tools that specialize in tracking in-app events, user journeys, and A/B testing
- UXCam: A sessions/heatmap tool for qualitative data
Feel free to stop reading now and click on those links. Keep reading if you’d like a more thorough explanation of why and how you should use these tools – and why we at Upstack Studio don’t!
The Value of Mobile App Analytics Tools
In app development, iteration based on user need is an endless cycle.
But how do we know what users need?
Sometimes they leave productive comments. Take this for example:
If this was our app, it would hurt to hear, but at least we know what to fix.
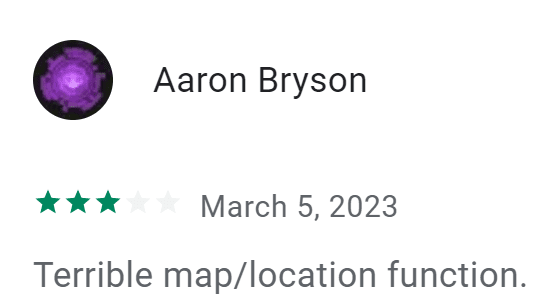
Sometimes, all they’ll say is this:

Our feelings are just as hurt, only we don’t know how to help.
To truly understand these users, mobile app analytics tools are the way to go.
In this article, we’ll be sharing two use cases in app development that do best with different sets of app analytics tools – nothing to do with cost, and everything to do with goals.
The first use case is app focused – dealing with bugs and keeping the app up-to-date and running as efficiently as possible.
It’s all about technical aspects and catered to mobile app developers like ourselves.
The second use case is user journey-focused – making sure that users are achieving their goals via the app. That’s what adds value to their lives and wins you their loyalty.
It’s far more holistic and if you’re a founder, this is what you need to look at.
First things first, we need to look at some key app analytics metrics.
Key Metrics for Mobile App Analytics
As a developer, Upstackers are interested in metrics measuring the technical aspects of an app.
If we were marketers, we’d be interested in metrics that track acquisition and conversion.
If we were founders, we’d be interested in all of them.
We’ll start with something that everyone should pay attention to.
User Flow
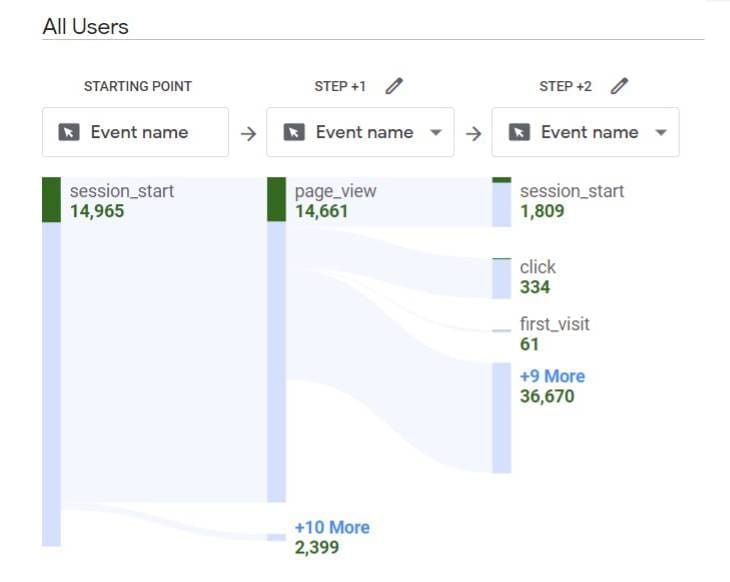
The user flow lets us see the path users take when they open the app and start navigating between events – the term for actions that people take on your app like tapping a button, downloading a file, or sending a message.
Some of these events are what we call goals – actions that define why you built the app in the first place.
Classic example: if you were running a marketplace app, you’d want your checkout page to be a goal.
If you were running a fitness tracker app, you’d want ‘start tracking’ and ‘end tracking’ to be a goal.
Between the first and goal events are other events, (AKA a funnel) and every extra step is a chance for something to go wrong.
The user flow indicates whether the funnel is working – ten users going into the funnel should end up as ten goal conversions.
If they’re dropping off midway, a developer needs to ensure it’s not app-related, and a marketer needs to make changes to make it more compelling.
App Performance Metrics
The next metrics are specific to app performance and would be something a developer looks at.
Crashes and ANR (Application Not Responding) errors
Crashing is not just a good way to get a 1-star rating and an angry review, but the app stores themselves can detect apps with high crash rates and will warn developers to get their act together.
If you don’t fix your app and it still crashes, they get taken down from the app stores altogether.
And not all crashes are created equal – there are crashes, and then there are user-perceived crashes, which users actually notice, and app stores are particularly finicky about them.
App Start-up Time
There are three different types of starts.
- First, you have a Cold start, where your app is being launched for the first time
- Next, a Warm start, where your app is relaunched after very recently being closed
- Lastly, we have Hot starts, where your app is running in the background and the system brings it to the foreground
It depends on the complexity of your app, but as per Google guidelines, Cold starts shouldn’t take longer than 5 seconds, Warm starts no longer than 2 seconds and 1.5 seconds for Hot starts.
Page Rendering Time
Rendering time means how long it takes to load images and text on the screen. If you’ve ever had a page appear with blank squares and janky alignment that slowly correct themselves as the page loads, you have experienced poor rendering.
It’s not possible to deliver a good user experience if pages take ten seconds to load, or worse, never load correctly.
User-centric Metrics
These metrics are for anyone responsible for growing the app’s user base and leading marketing campaigns.
Disclaimer: Upstack Studio is not a marketing agency and don’t pretend to be, but we can huff, puff, and fluff our way through basic marketing – Isn’t that what all marketers do anyway?

There are lots of specific metrics when it comes to tracking users; we’re just going to list the big ones here:
- User demographics
- Retention
- Conversion
- Cost per acquisition
- Customer Lifetime Value
- Session length
- Traffic source
Each of those metrics is a piece of an overall puzzle. Piece the puzzle together and you discover details about your users’ behaviors, preferences, and needs.
You take that information and decide what iterations to make to the app to better serve your users, keeping in mind you should still be profitable.
Then you and your developers discuss what changes can actually be made and we, the developers, start the iteration process while paying attention to our app performance metrics.
This goes on forever, or until you go bankrupt, whichever comes first.
Matching mobile app analytics tools to desired outcomes
There are no absolute best mobile app analytics tools, so always match the tools you use with the goals you’d like to achieve.
Simple example: Customer lifetime value.
Strictly as a developer, as long as it’s not caused by bugs or wonky UI, we don’t care how much our clients are making per customer.
If we were product managers and didn’t know this, we’d be fired.
First Use Case: App analytics tools for app and site performance
This is Upstack Studio’s use case. Our responsibility is to deliver an app that works well, which means:
- Killing bugs
- A seamless user flow, and
- Low startup and rendering times
For this, we’ve found that the basics are more than good enough:
- Google Analytics 4 for user event flows across Android, IoS, and web
- Firebase Crashlytics to track crashes, errors and bugs
With the new Google Analytics, you automatically get to see your Google Play app’s user flow, and to add your IoS app as a separate property, it’s just three simple steps – head over to the official guide and follow the instructions.
If you’ve done it right, your IoS app will be tracked as its own property so the user flow data is kept separate. I find it really useful for cross-platform apps because sometimes what works for Android won’t work for Apple and vice versa.
Between those three tools, any developer will have access to the metrics that matter to them.
Second Use Case: App analytics tools for user journey insights
This person’s duty is to understand who their users are, where they are, and what they want.
As a new founder, you’re going to be running lean. Someone has to look at the product analytics, and it’s preferably you because only you can really decide on the direction of the app.
That means:
- User demographics
- Marketing strategies
- New user acquisition and churn rates
- Customer lifetime values
- Total revenue
Our recommendation for mobile app analytics tools:
- Keep Google Analytics for ad campaigns and user acquisition tracking
- A core product analytics tool like Amplitude or Mixpanel to track user journeys and conduct A/B testing
- A mobile app sessions/heatmap tool like uxcam
Let’s start with why Google Analytics should stay.
Why keep Google Analytics?

Google Analytics lets you see what happens before users reach your app. It shows you the links your app has with various sources of user acquisition. Where are they coming from, what ads or keywords did they see and search for before ending up on your download page?
So if you want to launch and measure marketing campaigns, affiliate links, and viral videos, Google Analytics will help you do that. There’s nothing else quite like it, and it’s mostly free!
Why add a separate product analytics tool?

The product analytics tool will be your main weapon. Mixpanel, Amplitude, Heap, any and all of them – they let you:
- track user journeys
- group your users into separate personas based on behaviour, and
- set up A/B testing directly on the platform
We think that with Mixpanel in particular, you get a really easy-to-understand user interface. Amplitude, from what I’ve read is like the Bubble.io of product analytics – the most functions, but steepest learning curve.
Here’s a list of the top five mobile app product analytics tools and their specific USP – see which one sounds the most appealing to you and go with that.
- Amplitude – free tracking of up to 10 million events per month
- Mixpanel – (in our opinion) the most user-friendly interface
- Heap – the most comprehensive automated data collection
- Fullstory – most comprehensive playback of sessions (warning: most expensive on this list)
- Posthog – access to testing and heatmaps even on free plans
While each has slight differences and unique selling points, it’s not going to matter to you yet. Your main concern is to pick one and get used to it. It may be painful, it will be a pain in the ass. Your future self will thank you for it.
This is one of the rare cases where that pricing is a valid consideration: some charge based on the number of users, and others charge based on the number of events. The thing is, pretty much all of them offer free trials based on usage limits, not time, so you have nothing to lose here.
Why add a heatmap tool?

Heatmaps are recordings that show where users click, scroll, and spend the most time on your app screens. You can see what successfully grabs user attention and what doesn’t. Also, with session recordings, you can see where users might struggle to locate a certain button or complete an action.
This gives us powerful qualitative data to validate whatever is being indicated by the quantitative data from our product analytics tools as some of them don’t offer heatmapping and session recording on their platforms.
Say a lot of your users are not completing a certain action. You’ll want to know what’s going on, right? Well, record a session with your heatmap tool and you’ll be able to see how users are navigating the screen.
There may be others, but we believe the main option right now is UXCam, and yes, it also offers a free trial – they always do.
The best mobile app analytics tools need practice to work!
With these three mobile app analytics tools (Google Analytics, Amplitude or Mixpanel, and UXCam), you’ll have the capability to measure every aspect of your user journey and improve upon it. The biggest challenge is the initial learning curve – once you’re over that, app analytics becomes a lot easier.
Note: If you’d like to receive more tips on app idea strategies as well as on app development in general, sign up for our weekly newsletter to get quality information sent straight to your inbox. In the meantime, here’s a free app brief template for you to write down whatever ideas you have.
App Brief Template
Download this FREE editable template now to craft your perfect App Brief! Let us know where should we send it through the form below.